Retail today is becoming increasingly complicated; even the best products do not guarantee success. Smart decisions must be made using smart data. Whether you own a small coffee shop, an online store, or a multistore retail business, it becomes essential to know which products are selling like hotcakes and which are selling like snails. In Square Analytics, powerful reporting tools are provided, even in the free plan, to help sellers gain insights into what is working and what needs a rethink.
New to analytics? Don’t know how to make good use of your sales data? This guide will walk you through the key features of Square Analytics and when to use them to evaluate product performance and improve your profits.
What Is Square Analytics? A Beginner-Friendly Tool for Product Insights
Square Analytics is your built-in, behind-the-scenes business assistant ready to help you make smarter decisions without needing extra tools or a degree in data science. Whether you’re a small business owner just starting or a seasoned seller, Square Analytics is available to you right inside your Square Dashboard on desktop or mobile.
The best part? No complicated setup. No extra software. Just clear, actionable insights at your fingertips.
With Square Analytics, you can easily dig into things like:
- Sales volume over time
- Performance by product or category
- Customer behavior and repeat purchase trends
- Daily, weekly, and monthly sales patterns
Because it’s built directly into the platform, Square Analytics doesn’t require third-party tools, making it an ideal first step for businesses just beginning to explore data-driven decision-making.
How to Access Square Analytics in Your Dashboard?

Getting started is as easy as checking your email:
- Log in to your Square Dashboard (on your phone or computer).
- Head to the Reports tab.
- Choose a report that fits your needs.
Here are a few handy ones:
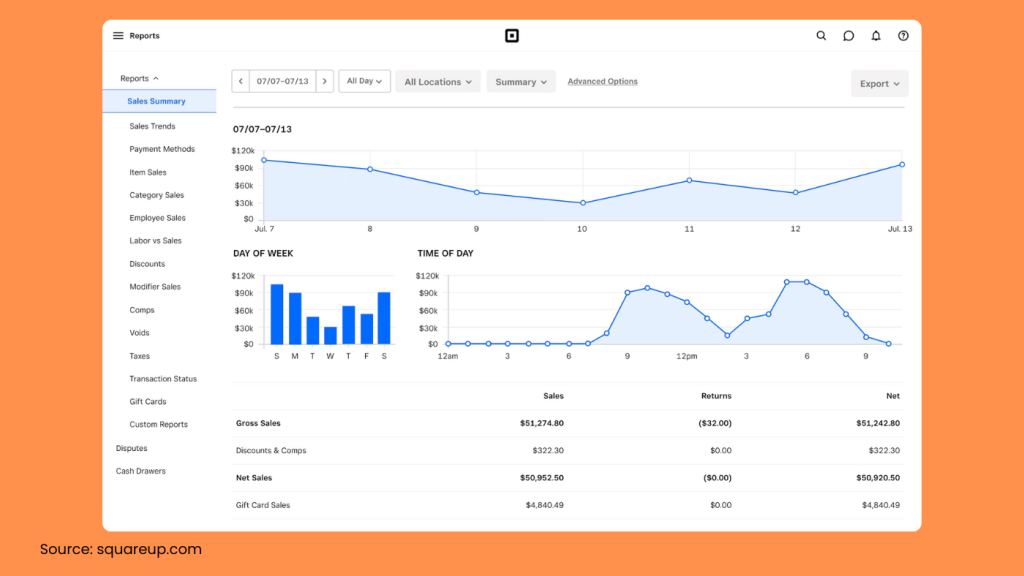
- Sales Summary: See total sales, refunds, and net revenue.
- Item Sales: Discover which specific items are driving revenue.
- Category Sales: View the performance of groups of items.
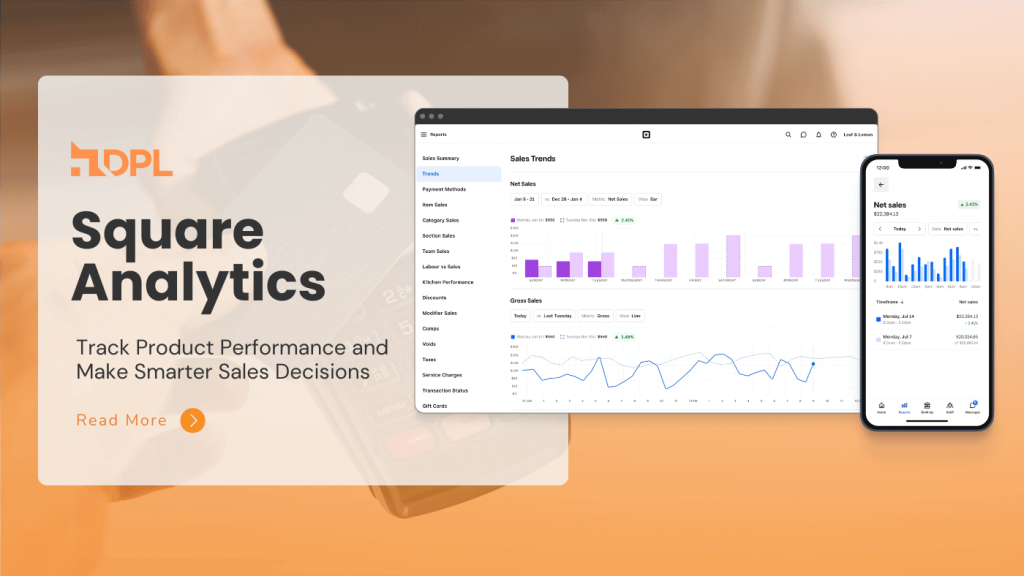
- Sales Trends: Spot patterns over time.
- Payment Methods: Understand how your customers prefer to make payments.
Each report gives you a piece of the puzzle, and together, they reveal what’s really going on in your business.
Using Square Analytics to Understand Product Performance
Once you’ve located the right reports, it’s time to use those insights to guide your next move.
1. Identify Your Top-Selling Products
Find out what customers love most. You can sort by daily, weekly, or monthly time frames to spot fast movers or seasonal hits. Use this info to:
- Restock popular items before they run out
- Launch targeted promotions
- Feature best-sellers in your store or online
2. Spot the Slow Sellers
Just as important is knowing what isn’t working. Use Square to identify products that are collecting dust or being returned too often. Then consider:
- Offering discounts or bundles
- Repositioning them in your store
- Retiring them from your lineup
3. Evaluate Performance by Category
Group your products, such as drinks vs snacks or skincare vs makeup, and identify which categories are driving growth. These insights help you:
- Allocate shelf space more wisely
- Forecast inventory more accurately
- Plan visually appealing merchandising displays

4. Analyze Time-Based Trends
Use Square’s built-in time filters to learn exactly when customers are buying. Are Saturday mornings your rush hour? Do sales dip midweek?
With this info, you can:
- Staff your store based on peak hours
- Run flash deals when sales are slow
- Adjust opening hours to match demand
Pro Tip: Make reviewing Square Analytics part of your weekly routine. You’ll start spotting patterns that help you stock smarter, promote better, and sell more.
Advanced Features in Square Analytics for Power Users
Once you’ve grasped the basics, Square Analytics offers a range of advanced features designed for businesses looking to scale and make more strategic decisions. These tools go beyond simple sales tracking, helping you gain deeper insights into operations, customer behavior, and cross-platform performance.
Multi-Location Reporting
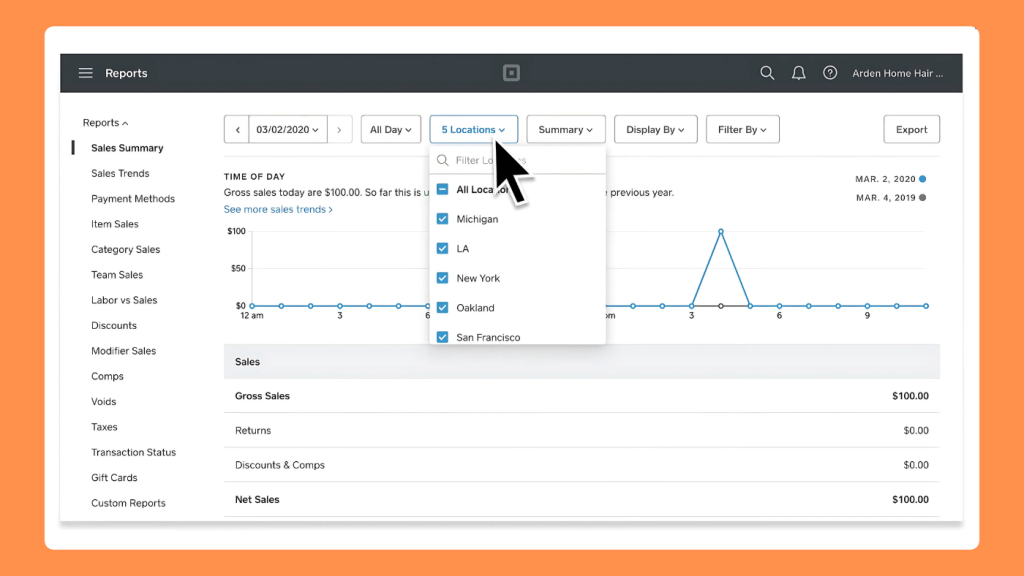
If you manage multiple stores, kiosks, or pop-ups, Square lets you compare sales across each location. You can pinpoint which store is performing best, understand regional product trends, and make more informed decisions about inventory, staffing, and promotions for each branch.

Customer Insights via Square Loyalty
When paired with Square Loyalty, your analytics dashboard becomes even more powerful. You can track repeat purchase behavior, monitor return rates, and uncover customer buying patterns. These insights enable you to personalize offers, enhance customer retention, and increase overall customer satisfaction.
CSV Export for Deeper Analysis
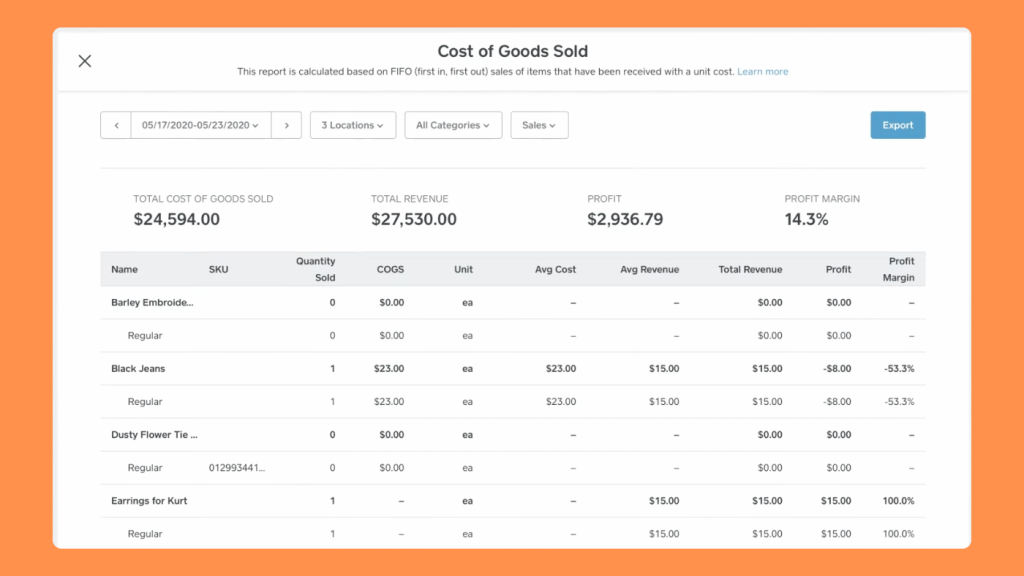
Need more flexibility? Export your sales data in CSV format and analyze it in Excel or Google Sheets. This enables you to create custom reports, calculate profit margins, forecast demand, or integrate your data with other tools for a tailored view of your business.
Omnichannel Sales Tracking with Shopify Integration
Selling online with Shopify and in-person with Square? Sync your platforms to consolidate sales data in one place. This unified view enables you to track product performance across all channels, better manage inventory, and deliver a consistent customer experience, whether customers shop online or in-store.
These advanced Square Analytics features offer a comprehensive and scalable data solution that grows with your business.
Common Square Analytics Mistakes and How to Avoid Them
Even the best tools need smart usage. Here are a few common missteps to watch for:
- Using the wrong date range: You might miss the bigger picture.
- Forgetting refunds: These impact your net sales and margins.
- Chasing revenue only: Profit margins matter more than just sales numbers.
- Reacting too quickly to one slow day: Focus on trends, not one-off dips.
The most successful sellers treat analytics as a regular habit, not just something they check during a sales slump.
Start Making Smarter Business Decisions with Square Analytics
Square Analytics puts powerful data in the hands of everyday business owners. Whether you’re testing new inventory, adjusting pricing, or planning your next big promo, your decisions don’t have to be guesses anymore; real numbers can guide them.
By checking in regularly, you’ll start to see what works, what doesn’t, and what your customers are really telling you with their wallets.
And if you’re selling in-store with Square and online with Shopify, syncing both platforms gives you a true 360° view of your business performance, helping you grow smarter, not just harder.
Start using Square Analytics today and turn your numbers into real growth. Log in to your Square Dashboard now and see what your sales data has been trying to tell you all along.
How often should I check Square Analytics to make smarter decisions?
It’s best to review your analytics weekly. This allows you to catch trends early, such as rising demand for a product or a sudden dip in sales, without overreacting to daily fluctuations. Many successful sellers set aside a fixed time each week (e.g., Monday mornings) to review reports before making inventory or marketing decisions.
What should I do if my best-selling products keep going out of stock?
If Square Analytics shows repeated stock-outs, it’s a signal to adjust your inventory planning. Consider:
– Increasing your reorder quantity or frequency.
– Setting low-stock alerts in your Square Dashboard.
– Using sales trends (daily/weekly) to forecast demand more accurately.
This ensures you capture sales instead of losing customers to competitors.
How can I use Square Analytics to improve profit, not just sales?
Don’t only chase revenue numbers. Use Item Sales and Category Sales reports alongside cost data to identify which products bring the highest margins. You may find that a steady mid-seller is actually more profitable than a popular but low-margin product. Prioritize promotions around higher-margin items to maximize profit.
Can I combine Square Analytics data with other tools like Excel or Shopify?
Yes. With the CSV export feature, you can pull your data into Excel or Google Sheets for deeper analysis like custom dashboards, demand forecasting, or calculating margins. And if you’re also selling online with Shopify, Square Shopify Sync helps you track omnichannel performance in one place, ensuring you make consistent and data-driven decisions across sales channels.
Related Read: How Much Does a Square POS System Cost in 2025?
Understanding your sales data is only one piece of the puzzle. To truly maximize profits, you also need the right setup at the right cost. Square POS offers everything from a free mobile reader to a full in-store register, and knowing the costs upfront helps you plan smarter.
Check out our full breakdown here: How Much Does a Square POS System Cost? A Complete Breakdown for Businesses in 2025
